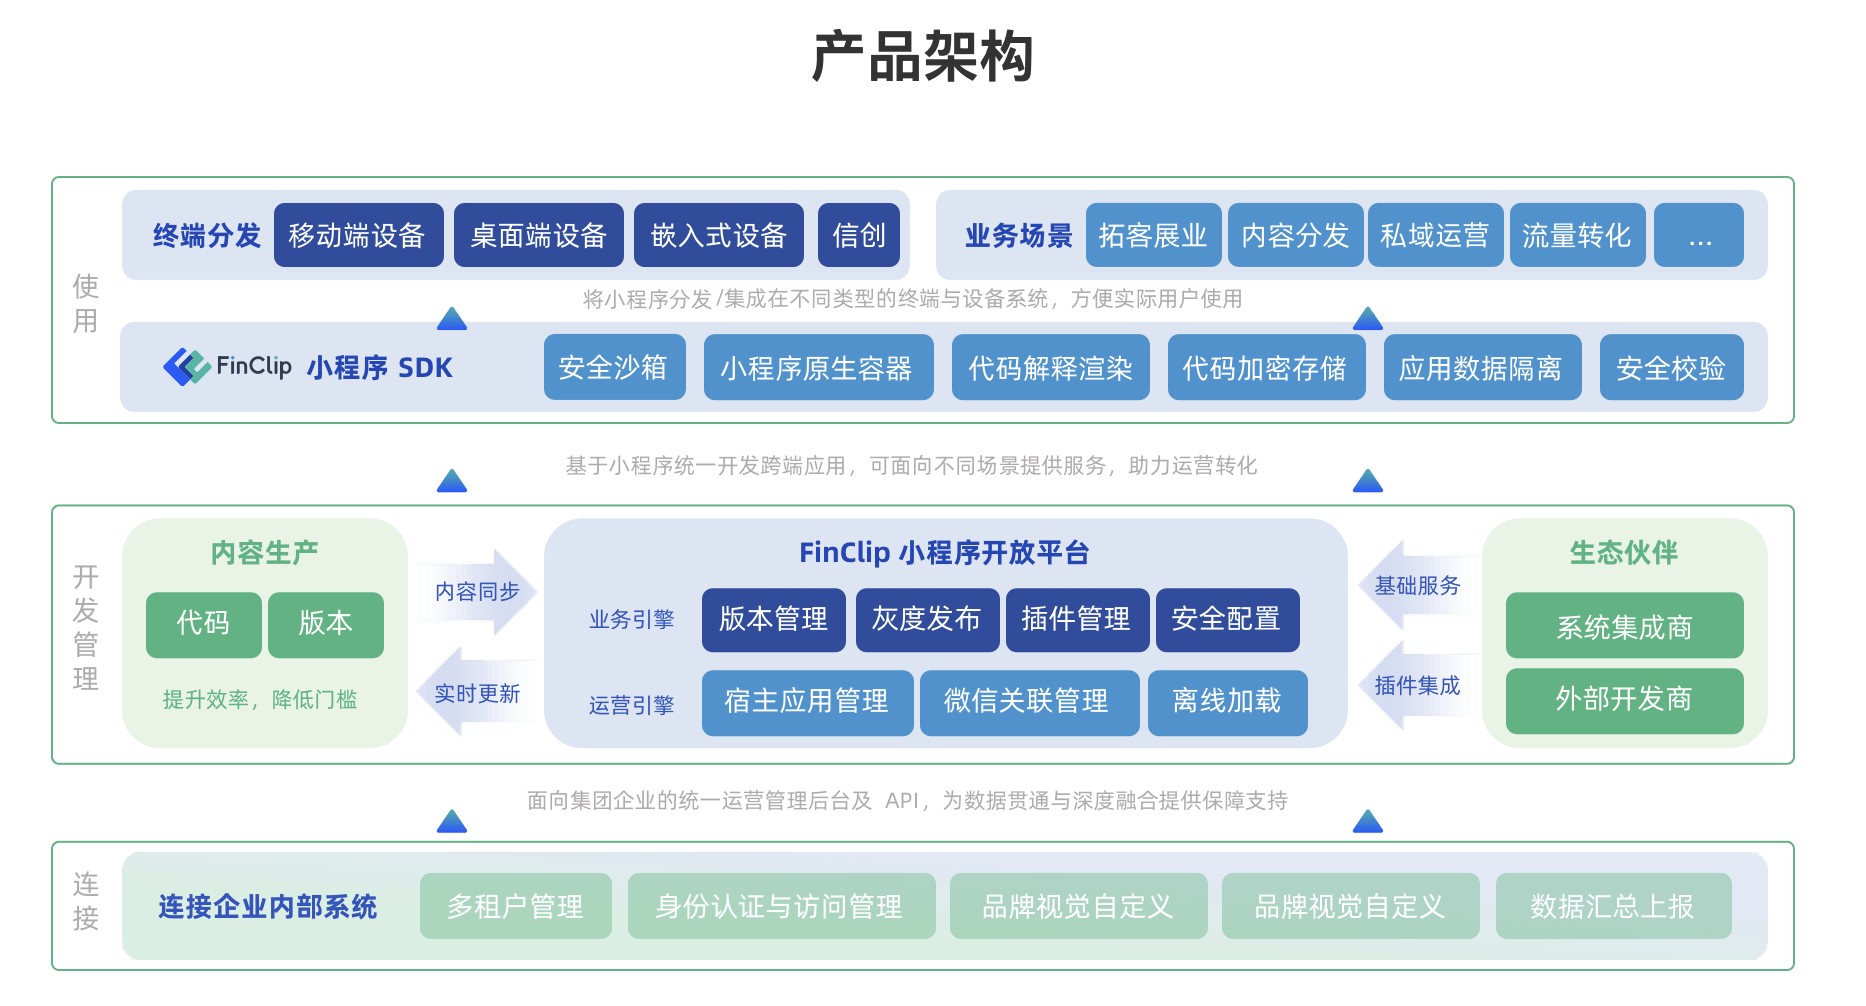
后台小程序开发的全方位指南
1043
2022-11-16

python 学习笔记

输出 helloworld
S = "helloworld"print(S)
简单的函数
def area(height, width) : return height * width a = int(input())b = int(input())print("Area = ", area(a, b))
list
my_list = [1, 3, 5, 7]print(my_list[-2]) # output : 5print(my_list[1])print(my_list[0:4]) # [0, 4) print(my_list) # output : [1, 3, 5, 7]my_list.append(9) print(my_list[3:5]) # output : [7, 9] my_list.remove(7) print(my_list) # output : [1, 3, 5, 9]
for 循环遍历 list
for i in my_list : print(i, end = " ") # end -> 输出不换行
os 模块传送门
import os print(os.listdir()) # os.listdir() 返回的是文件名列表 print(os.getcwd()) # 返回当前文件的工作目录path = os.getcwd() print(os.listdir(path)) for file in os.listdir() : print(file) print(os.path.join(os.getcwd(), file)) # 感觉 join 就是把文件名字符串拼一下os.mkdir(os.path.join(path, "mybox")) # 建文件夹path = os.path.join(path, "mybox") os.mkdir(os.path.join(path, "temp")) os.rename("1.in", "2.in") # 这样批量改名就很方便了!
enumerate
for index, item in enumerate(my_list) : print(index, item)
加法和字符串
a = 2b = 3print(a + b)print(str(a) + str(b))
文件读写
file = open("1.in", "r") # r : read, w : write, r+ : r + wprint(file.name) print(file.mode) file.close() with open ("1.in", "r") as file : print(file.name) # 会自动关闭文件 with open ("1.in", "r") as file : content = file.read() print(content[0 : 200]) # 输出文件的前 200 个字符 with open ("1.in", "r") as file : content_lst = file.readlines() # 读所有行,存在列表print(content_lst) f_contents_lst = []with open('1.in', 'r') as f: for line in f: line = line.replace("\n","") line = line.split(" ") f_contents_lst.append(line)print(f_contents_lst) # 切成若干单词,存进 list
matplotlib 输入命令:pip install matplotlib -i 光速安装
画折现图
from matplotlib import pyplot as plt # 可以指定一个别名,类似 define x = [25, 26, 27, 28, 29, 30, 31, 32, 33, 34, 35]y = [38496, 42000, 46752, 49320, 53200, 56000, 62316, 64928, 67317, 68748, 73752]plt.plot(x, y)plt.xlabel("Ages") plt.ylabel("Median Salary in 2019")plt.title("Median Salary by Age")plt.xlim(24,36)plt.ylim(20000,90000)plt.legend(loc='upper right') # 图例位置plt.show() x = [25, 26, 27, 28, 29, 30, 31, 32, 33, 34, 35]y1 = [38496, 42000, 46752, 49320, 53200, 56000, 62316, 64928, 67317, 68748, 73752]y2 = [32000, 38000, 48000, 50000, 60000, 80000, 70000, 60000, 65000, 55000, 50000]plt.plot(x, y1, label = "All developer", color="blue", linewidth=2.5, linestyle="-", marker = "o")plt.plot(x, y2, label = "Python developer" , color="red", linewidth=2.5, linestyle="--", marker = "x")# marker : . , o p xplt.show()
画柱状图
langs = ['C','C++','Java','Python','PHP']students = [23,17,35,29,12]plt.bar(langs, students)plt.xlabel('Programming language')plt.ylabel('Students')plt.title('Students using different programming languages')plt.show()
读 excel(使用 pandas 工具)
data = pd.read_excel('a.xls')num = data["number"]sco = data["score"]print(sco)
numpy 工具 速度快,内存小的向量运算
import numpy as np a = np.array([1,2]) + np.array([3,4])print(a) # [4,6]a = np.array([1,2]) * np.array([3,4])print(a) # [3,8]a = np.array([1,2]) * 2print(a) # [2,4]b = np.array([[9.0,8.0,7.0],[6.0,5.0,4.0]])print(b)x = [1, 2, 3, 4]y = [2, 3, 4, 5]x = np.asarray(x) print(a.ndim)print(b.ndim)print(a.shape)print(b.shape)print(x.shape)print(b[1, 1]) print(b[1, :])print(b[:, 1])x = x.reshape(2, 2)print(x[0, :])print(x[:, 0])x = x.flatten() z = x / y # broadcast z = z ** 2 print(z)
Broadcast 机制: Image (3d array): 256 x 256 x 3 Scale (1d array): 3 Result (3d array): 256 x 256 x 3 A (4d array): 8 x 1 x 6 x 1 B (3d array): 7 x 1 x 5 Result (4d array): 8 x 7 x 6 x 5 需要满足 数组拥有相同形状 or 当前维度的值相等 or 当前维度的值有一个是 1
数学函数
a = np.array([0,30,45,60,90])print (np.sin(a*np.pi/180))a = np.array([[1,2,3,4],[3,4,5,6]])print (np.mean(a))print (np.mean(a, axis = 0)) # 列print (np.mean(a, axis = 1)) # 行a = np.array([1,3,5,8,13,14,15,20])print(np.median(a)) # 中位数print(np.std(a)) # 标准差
持续更新 …
版权声明:本文内容由网络用户投稿,版权归原作者所有,本站不拥有其著作权,亦不承担相应法律责任。如果您发现本站中有涉嫌抄袭或描述失实的内容,请联系我们jiasou666@gmail.com 处理,核实后本网站将在24小时内删除侵权内容。
发表评论
暂时没有评论,来抢沙发吧~